Target Audience:
- Quality control and assurance professionals
- Process improvement teams
- Engineers and production managers
- Supervisors and team leaders
- Anyone involved in problem-solving and continuous improvement
Course Objectives:
By the end of this training, participants will:
- Understand the fundamentals of quality control and problem-solving techniques.
- Learn how to apply the 7 QC tools effectively in real-world scenarios.
- Develop data-driven decision-making skills for process improvement.
- Enhance their ability to identify root causes and implement corrective actions.
- Gain hands-on experience in using the tools through case studies and exercises.
Learning Outcomes:
Upon completing this course, participants will be able to:
✔ Define and explain the purpose of each of the 7 QC tools.
✔ Collect, analyze, and interpret data using these tools.
✔ Apply the tools in process monitoring and problem-solving.
✔ Create visual representations of data to support decision-making.
✔ Identify trends, root causes, and potential improvements in processes.
✔ Implement the tools in a structured approach to quality improvement.
Course Outline:
Module 1: Introduction to Quality Control & 7 QC Tools
- Definition and importance of quality control
- The role of the 7 QC tools in quality improvement
- Overview of Continuous Improvement (Kaizen, PDCA Cycle)
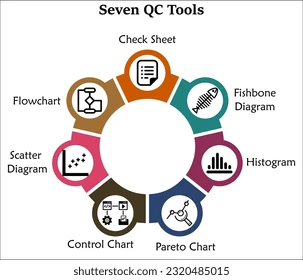
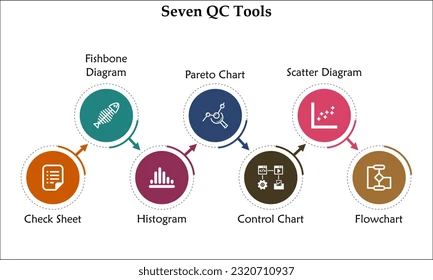
Module 2: The 7 QC Tools Overview & Application
1. Check Sheets
- Purpose and types of check sheets
- Designing an effective check sheet
- Practical exercise
2. Pareto Chart
- Understanding the Pareto principle (80/20 rule)
- Constructing and interpreting Pareto charts
- Case study application
3. Cause-and-Effect Diagram (Fishbone/Ishikawa Diagram)
- Identifying root causes of problems
- Categorizing causes using the 6Ms (Man, Machine, Method, Material, Measurement, Environment)
- Hands-on exercise
4. Histogram
- Understanding variation in data
- Creating and interpreting histograms
- Real-life examples
5. Scatter Diagram
- Analyzing relationships between variables
- Identifying correlation and causation
- Practical analysis using real data
6. Control Charts
- Basics of statistical process control (SPC)
- Types of control charts (X-bar, R-chart, P-chart, C-chart)
- Monitoring process stability
7. Flowchart (Process Mapping)
- Importance of visualizing processes
- Creating process maps for problem identification
- Exercise in process mapping
Module 3: Integrating the 7 QC Tools in Problem-Solving
- Combining tools for effective root cause analysis
- Case study: Applying the tools in a real-world scenario
- Group exercise: Solving a quality issue using the 7 QC tools
Module 4: Implementation & Continuous Improvement
- Best practices for embedding the 7 QC tools in daily operations
- Sustaining a quality-driven culture
- Action planning for workplace implementation
Training Methodology:
✅ Interactive Lectures – Concept explanations with real-world examples
✅ Hands-on Exercises – Application of each tool through guided activities
✅ Case Studies – Real-life industry examples for deeper understanding
✅ Group Discussions & Workshops – Collaborative learning and problem-solving
✅ Software Tools (Optional) – Use of Excel, Minitab, or other software for data analysis