Course Duration:
2 Days (16 Hours)
Target Audience:
- Quality Engineers
- Process Engineers
- Production Supervisors
- Manufacturing and Quality Control Personnel
- Six Sigma Practitioners
- Anyone involved in data collection and process improvement
Course Objectives:
By the end of this course, participants will:
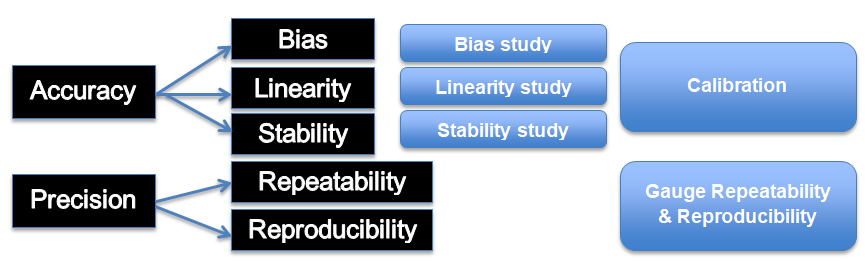
- Understand the fundamental concepts of Measurement System Analysis (MSA) and Statistical Process Control (SPC).
- Learn how to evaluate and improve measurement system accuracy, precision, and stability.
- Apply MSA tools such as Gauge Repeatability & Reproducibility (Gauge R&R), Bias, Linearity, and Stability Studies.
- Gain hands-on experience in conducting MSA studies and analyzing measurement system performance.
- Learn how to implement SPC techniques, including control charts, process capability studies, and variation analysis.
- Interpret control charts to differentiate between common cause and special cause variation.
- Develop the ability to make data-driven decisions for process improvements.
Learning Outcomes:
Upon successful completion, participants will be able to:
✅ Conduct Measurement System Analysis (MSA) studies and interpret results.
✅ Perform Gauge R&R analysis using software tools such as Minitab or Excel.
✅ Identify sources of measurement variation and take corrective actions.
✅ Set up and use Statistical Process Control (SPC) tools, including control charts and capability analysis.
✅ Monitor and analyze process performance using SPC methods.
✅ Make informed quality control decisions based on statistical analysis.
Course Outline:
Day 1: Measurement System Analysis (MSA)
Module 1: Introduction to Measurement System Analysis (MSA)
- Definition and Importance of MSA
- Types of Measurement Errors
- Key MSA Terminologies
Module 2: Gauge Repeatability and Reproducibility (Gauge R&R)
- Understanding Repeatability vs. Reproducibility
- Conducting a Variable (Continuous Data) Gauge R&R Study
- Conducting an Attribute (Discrete Data) Gauge R&R Study
- Interpreting Gauge R&R Results
- Hands-on Practice with Real Data
Module 3: Other MSA Studies
- Bias Study: Assessing systematic measurement error
- Linearity Study: Evaluating measurement variation over a range
- Stability Study: Checking measurement consistency over time
- Workshop: Conducting Bias, Linearity, and Stability Studies
Day 2: Statistical Process Control (SPC)
Module 4: Introduction to Statistical Process Control (SPC)
- Definition and Benefits of SPC
- Variation in Processes: Common Cause vs. Special Cause
- Types of SPC Charts (Variable & Attribute Data)
Module 5: Control Charts for Variables (Continuous Data)
- X̄-R and X̄-S Charts
- Individual Moving Range (I-MR) Charts
- Interpreting Control Charts
- Hands-on Exercise: Plotting and Analyzing Control Charts
Module 6: Control Charts for Attributes (Discrete Data)
- P-Charts (Proportion of Defectives)
- NP-Charts (Number of Defectives)
- C-Charts (Defects per Unit)
- U-Charts (Defects per Sample Size)
- Case Study: Application in Real-World Scenarios
Module 7: Process Capability Analysis
- Cp, Cpk, Pp, Ppk Analysis
- Using SPC to Improve Process Capability
- Hands-on Practice: Calculating and Interpreting Cp & Cpk
Module 8: Implementing SPC in Industry
- How to Sustain SPC in the Workplace
- Linking SPC with Continuous Improvement (Six Sigma & Lean)
- Case Studies and Group Discussion
Training Methodology:
🔹 Interactive Lectures – Conceptual explanations with real-life industry examples
🔹 Hands-on Workshops – Practical exercises using measurement tools, Minitab/Excel
🔹 Case Studies – Analyzing real-world data to apply MSA and SPC concepts
🔹 Group Discussions & Problem Solving – Encouraging peer learning
🔹 Live Demonstrations – Conducting Gauge R&R and SPC control charting in a practical setting
🔹 Assessment & Certification – Quiz, practical exercises, and final evaluation