Microsoft Power BI
Description
COURSE OUTLINE
Day 1: Introduction to Power BI and Basic Data Handling
Objectives:
1. Understand the fundamentals of Power BI.
2. Learn to connect to various data sources.
3. Perform basic data transformations.
4. Create simple visualizations.
5. Build a basic data model.
Learning Outcomes:
- Participants will be able to explain the core components and services of Power BI.
- Participants will be able to connect Power BI to different data sources such as Excel, CSV, and databases.
- Participants will be able to perform basic data transformations using Power Query.
- Participants will be able to create basic visualizations like charts and tables.
- Participants will be able to build a simple data model and understand relationships between tables.
Morning Session:
1. Introduction to Power BI:
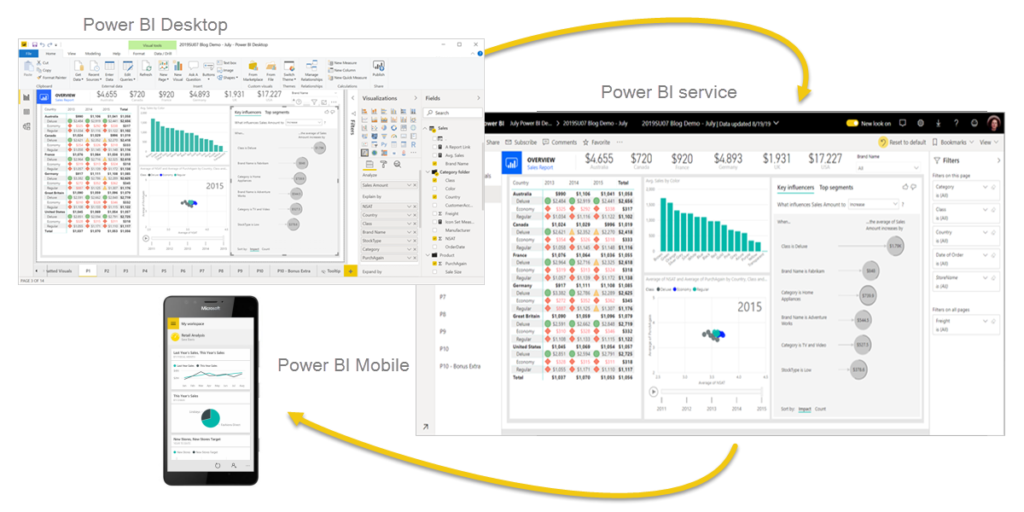
- Overview of Power BI components and services.
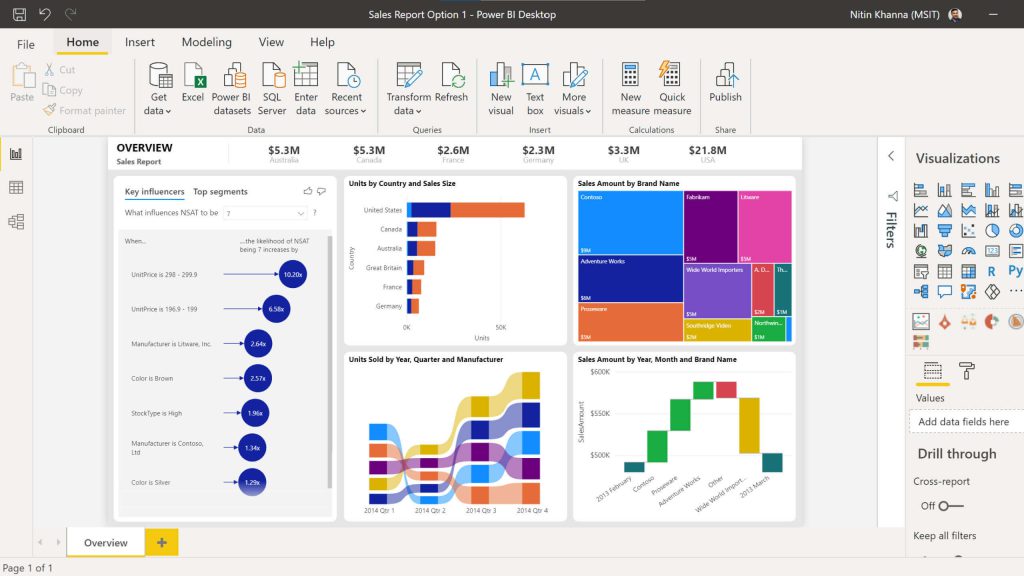
- Power BI Desktop, Power BI Service, and Power BI Mobile.
- Licensing and deployment options.
Why Learn Power BI?
- Importance in the industry: Widely used for business analytics.
- Enhances data-driven decision making.
- User-friendly interface for both technical and non-technical users.
- Integration with other Microsoft tools (Excel, Azure, etc.).
- Career advancement opportunities.
2. Connecting to Data Sources:
- Connecting to Excel, CSV, and databases.
- Loading and transforming data using Power Query.
Afternoon Session:
3. Basic Data Transformations:
- Filtering, sorting, and removing duplicates.
- Merging and appending data.
4. Creating Visualizations:
- Introduction to data visualization.
- Creating basic charts and tables.
- Formatting and customizing visualizations.
Day 2: Advanced Data Modeling and Visualization
Objectives:
1. Perform advanced data transformations.
2. Create calculated columns and measures using DAX.
3. Build advanced visualizations.
4. Design interactive dashboards.
5. Share and collaborate on reports.
Learning Outcomes:
- Participants will be able to perform advanced data transformations using Power Query.
- Participants will be able to create calculated columns and measures using DAX.
- Participants will be able to build advanced visualizations like maps and custom visuals.
- Participants will be able to design interactive dashboards with drill-through and drill-down options.
- Participants will be able to share and collaborate on reports using Power BI Service.
Morning Session:
1. Advanced Data Transformations:
- Advanced transformations with Power Query.
- Data profiling and cleaning.
2. DAX Fundamentals:
- Creating calculated columns and measures.
- Using time intelligence functions.
Afternoon Session:
3. Advanced Visualizations:
- Creating custom visualizations.
- Using bookmarks and buttons for interactivity.
4. Dashboard Design:
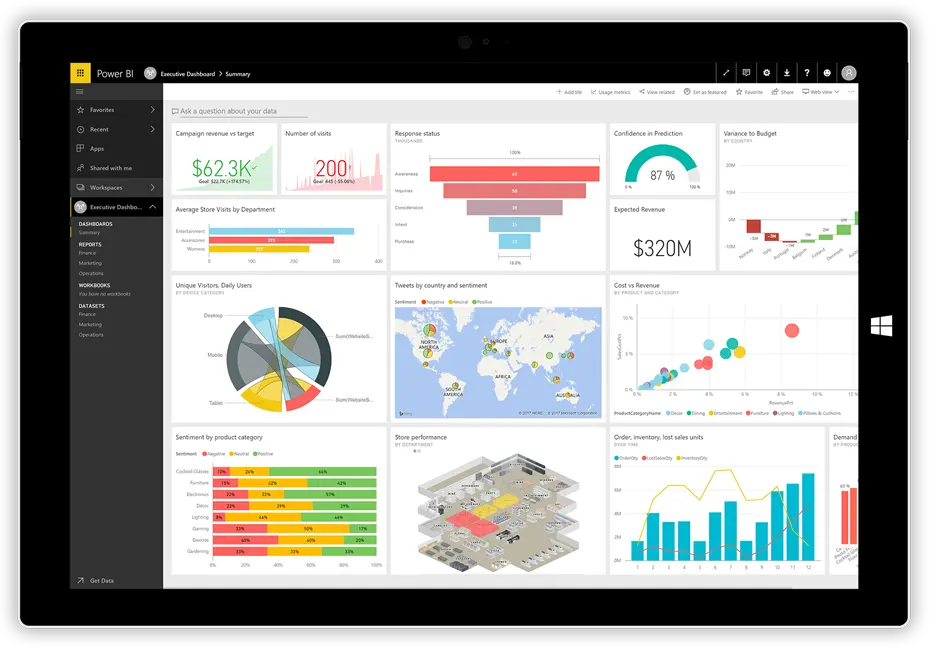
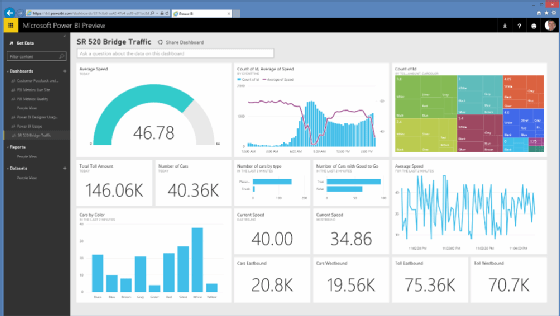
- Designing interactive dashboards.
- Using KPIs and scorecards.
5. Sharing and Collaboration:
- Publishing reports to Power BI Service.
- Collaborating with others on dashboards.
Learning Power BI can significantly enhance your ability to make data-driven decisions, streamline your data analysis processes, and advance your career in data analytics and business intelligence. It's a powerful tool that enables users to turn data into insightful and actionable information.
Listing Video
Location
Review
Write a ReviewThere are no reviews yet.

