


Popular

1. Understand the fundamentals of Power BI.
2. Learn to connect to various data sources.
3. Perform basic data transformations.
4. Create simple visualizations.
5. Build a basic data model.
1. Introduction to Power BI:
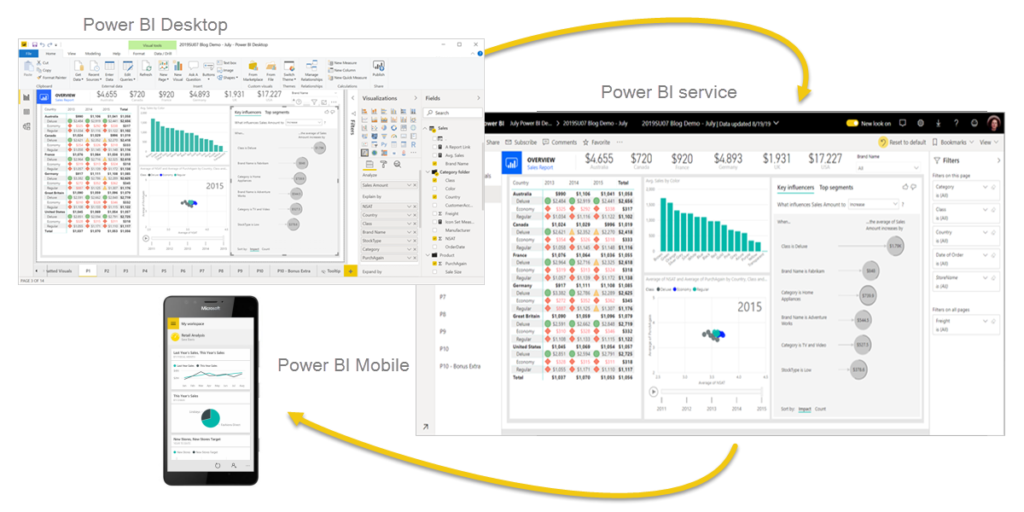
– Overview of Power BI components and services.
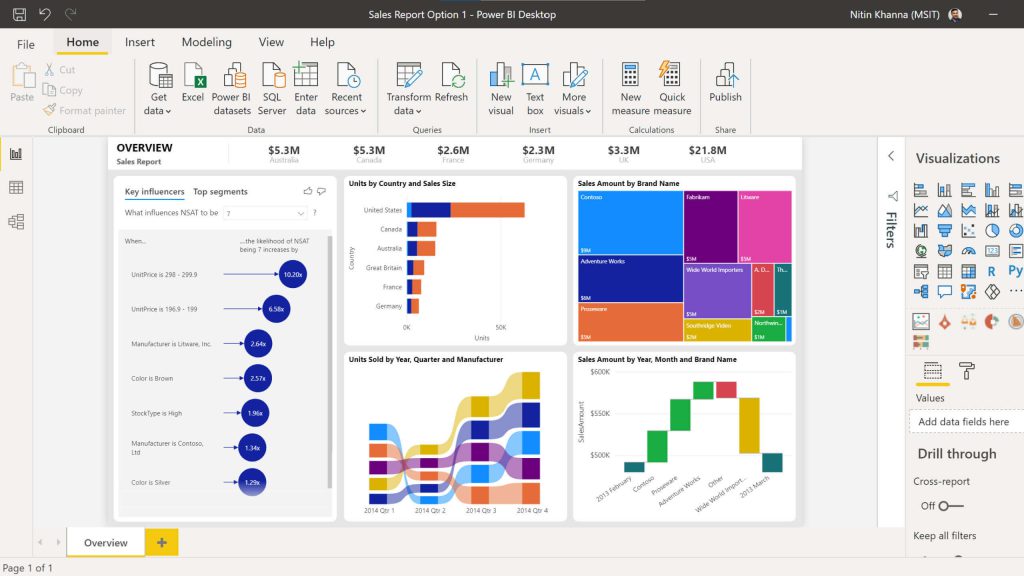
– Power BI Desktop, Power BI Service, and Power BI Mobile.
– Licensing and deployment options.
Why Learn Power BI?
– Importance in the industry: Widely used for business analytics.
– Enhances data-driven decision making.
– User-friendly interface for both technical and non-technical users.
– Integration with other Microsoft tools (Excel, Azure, etc.).
– Career advancement opportunities.
2. Connecting to Data Sources:
– Connecting to Excel, CSV, and databases.
– Loading and transforming data using Power Query.
3. Basic Data Transformations:
– Filtering, sorting, and removing duplicates.
– Merging and appending data.
4. Creating Visualizations:
– Introduction to data visualization.
– Creating basic charts and tables.
– Formatting and customizing visualizations.
1. Perform advanced data transformations.
2. Create calculated columns and measures using DAX.
3. Build advanced visualizations.
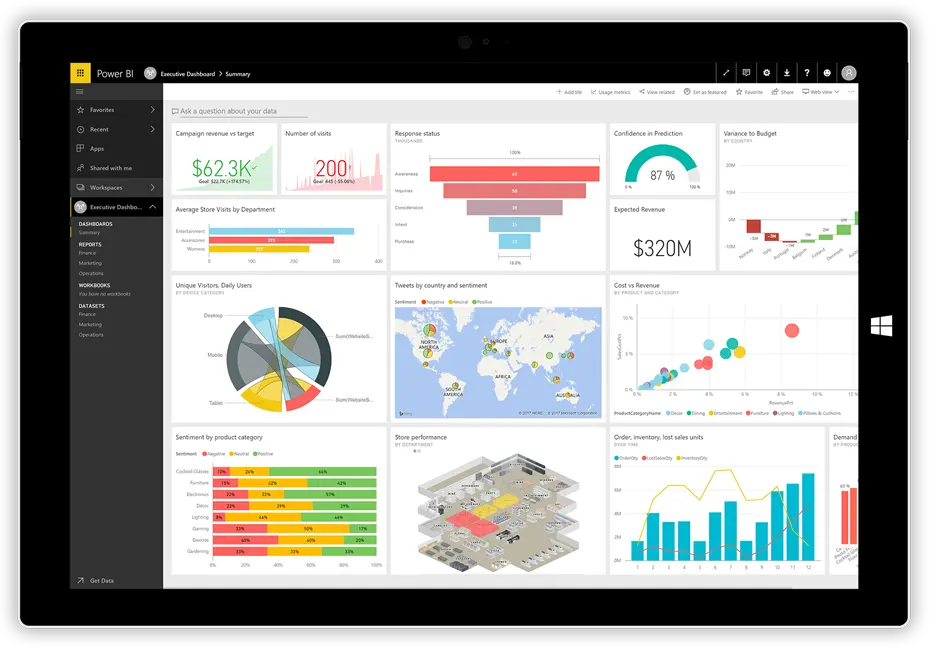
4. Design interactive dashboards.
5. Share and collaborate on reports.
– Participants will be able to perform advanced data transformations using Power Query.
– Participants will be able to create calculated columns and measures using DAX.
– Participants will be able to build advanced visualizations like maps and custom visuals.
– Participants will be able to design interactive dashboards with drill-through and drill-down options.
– Participants will be able to share and collaborate on reports using Power BI Service.
1. Advanced Data Transformations:
– Advanced transformations with Power Query.
– Data profiling and cleaning.
2. DAX Fundamentals:
– Creating calculated columns and measures.
– Using time intelligence functions.
3. Advanced Visualizations:
– Creating custom visualizations.
– Using bookmarks and buttons for interactivity.
4. Dashboard Design:
– Designing interactive dashboards.
– Using KPIs and scorecards.
5. Sharing and Collaboration:
– Publishing reports to Power BI Service.
– Collaborating with others on dashboards.
Learning Power BI can significantly enhance your ability to make data-driven decisions, streamline your data analysis processes, and advance your career in data analytics and business intelligence. It’s a powerful tool that enables users to turn data into insightful and actionable information.
There are no reviews yet.